Market Dashboards
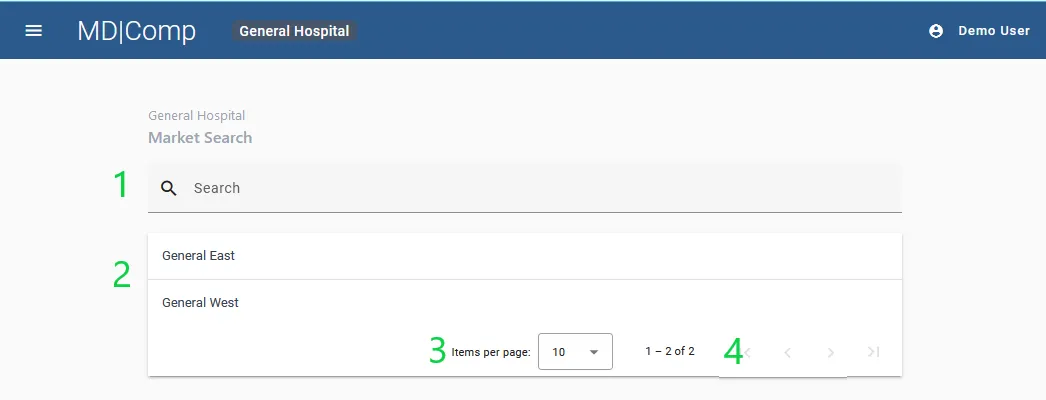
Market Selection
On the Market selection page, the Markets that are assigned to you are visible in a searchable list. You can scroll by page or search for the Market’s name. The number of items displayed can also be specified in the items per page toggle.
To navigate to a specific Market, click on it in the list.
- Market search bar
- List of Markets
- Number of items per page
- Page navigation
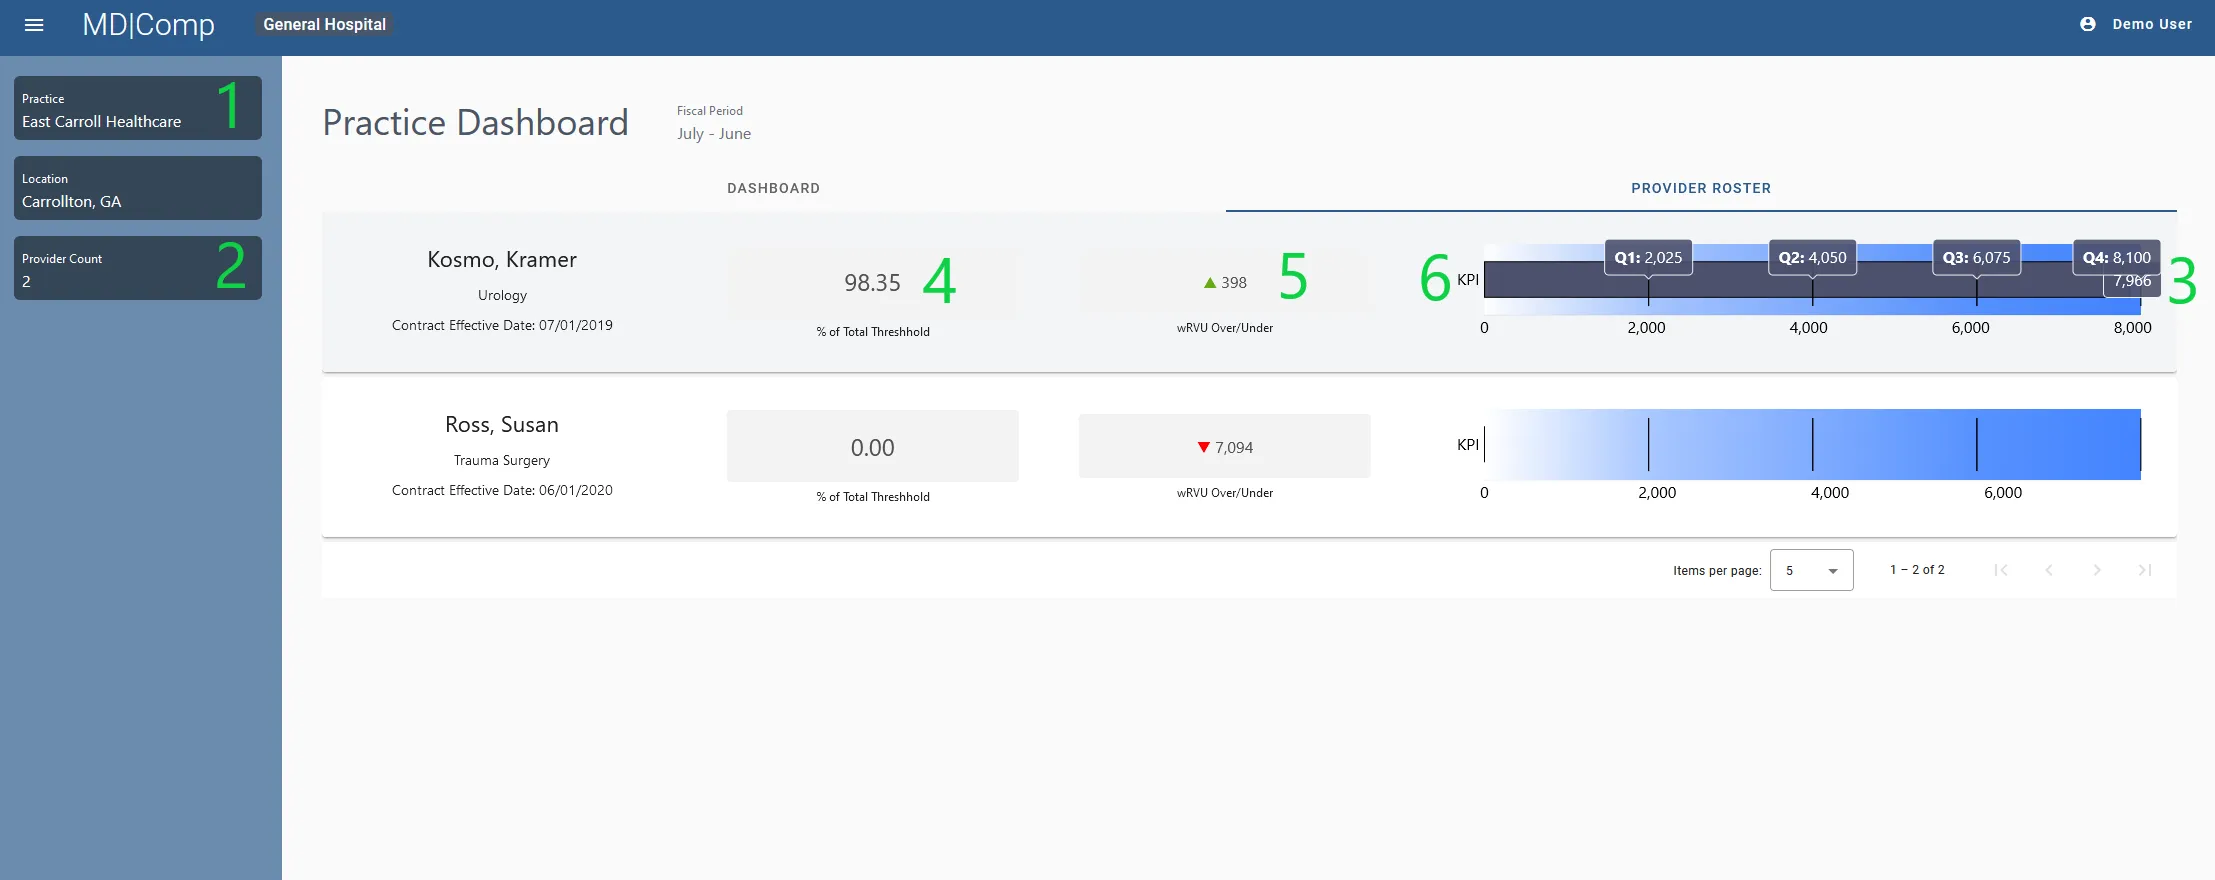
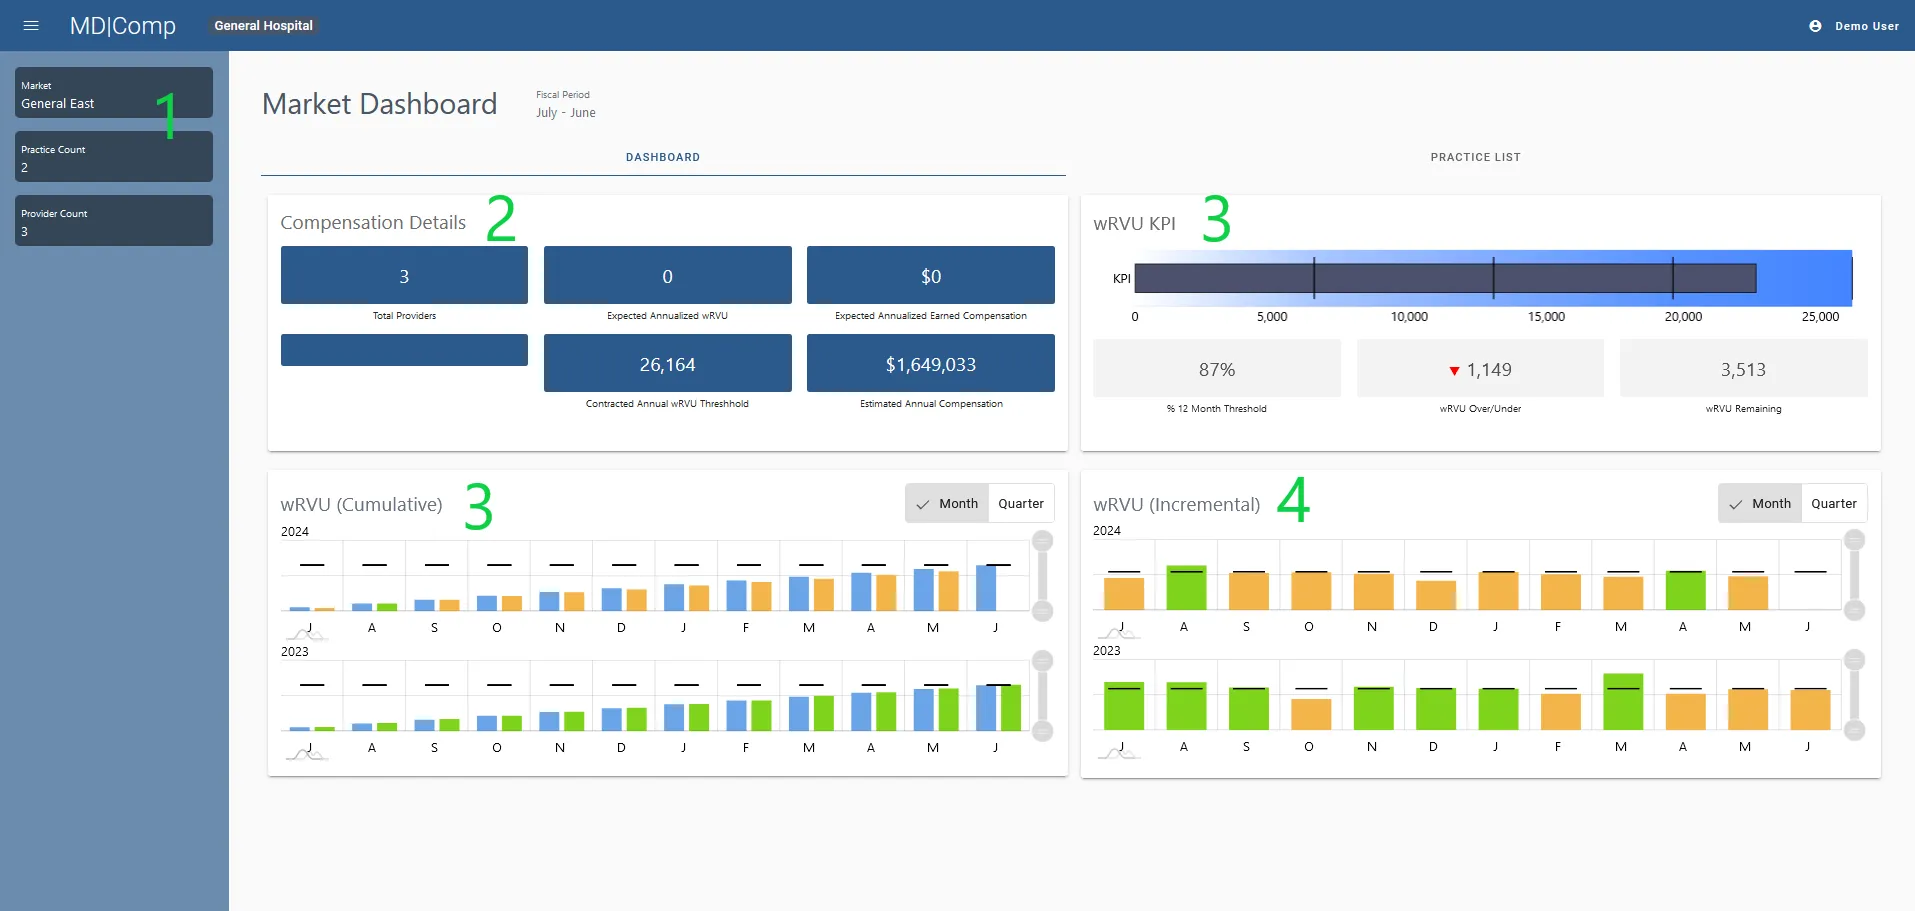
The Market Dashboard
The Market Dashboard is intended to provide a general overview of the performance of the Market as a whole.
All information in the Market Dashboard is based on the total for all providers in the Market, and the data shown is based on your organization’s fiscal year. Your organization’s fiscal year is displayed at the top of the Market Dashboard.
The Market Dashboard is composed of 5 main areas of practice information:
- Basic Market information
- Compensation details
- wRVU KPIs
- wRVU Cumulative wRVU KPIs
- wRVU Incremental wRVU KPIs
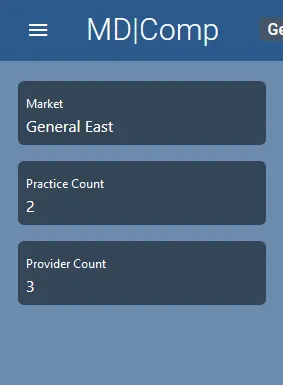
1. Basic Market information
The name of the Market, Practice count, and Provider count is visible on the left-hand side of the screen.
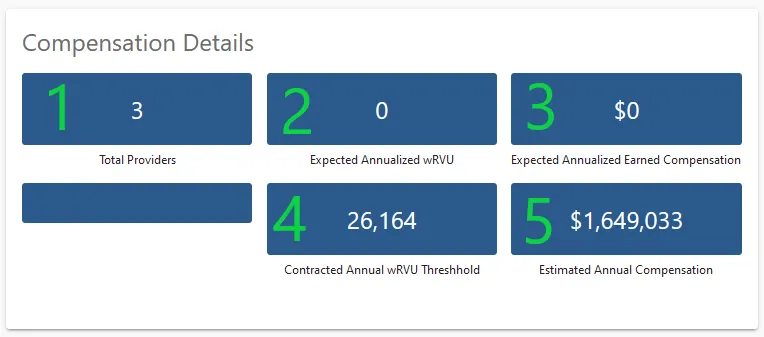
2. Compensation details
In the Compensation Details widget in the dashboard window, displayed is the totals for the Market for each category:
- Total Providers
- Expected Annualized wRVU
- Expected Earned Annual Compensation
- Contracted Annual wRVU Thresholds (12 month period based on organization’s fiscal year).
- Estimated Annual Compensation
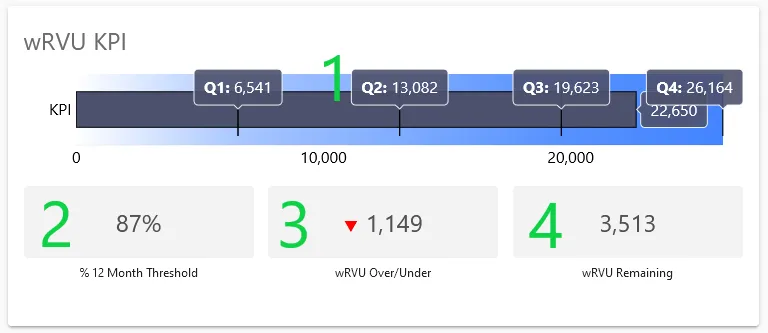
3. wRVU KPIs
The wRVU KPI Window on the Practice Dashboard identifies:
- The Fiscal Year to Date total wRVU produced by providers in the market (hover or tap the bar to see figures)
- The percentage of the 12-month Threshold that has been met
- How may wRVUs over or under the market is based on the current quarter
- How many wRVUs are remaining for that year
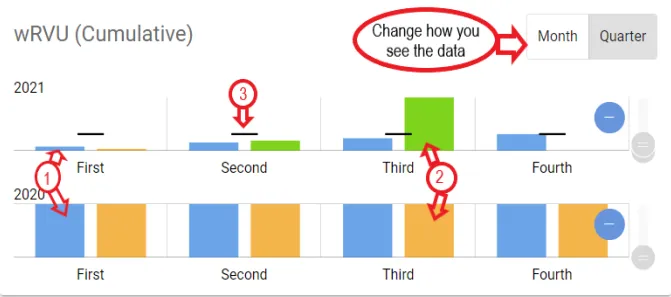
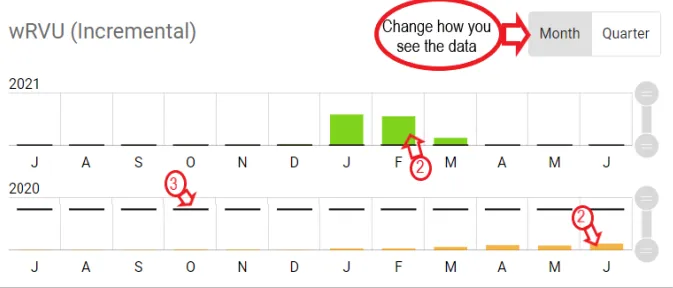
4. wRVU Cumulative/ wRVU incremental KPIs
- Cumulative and Incremental wRVUs are shown by month or quarter, based on the Enterprise Fiscal Year.
- The month/quarter toggle buttons are seen at the top right of each window -Toggles are shown next to each data set and can be used to enhance the data view.
- The Cumulative Graph depicts the actual wRVUs through the year by month or quarter as compared to the threshold expectation
- The Incremental Graph depicts the actual wRVUs by individual period as compared to the threshold expectation
- At the market level, wRVU totals represent wRVUs for all providers in that market
- In both graphs, a comparison to the previous year is also provided.
Key for interpreting the chart:
- Blue Bars= Expected Threshold for the period selected.
- Orange/Green Bars= Actual wRVUs (Bars turn green if the threshold is met).
- Black Line = Goal for the period selected.
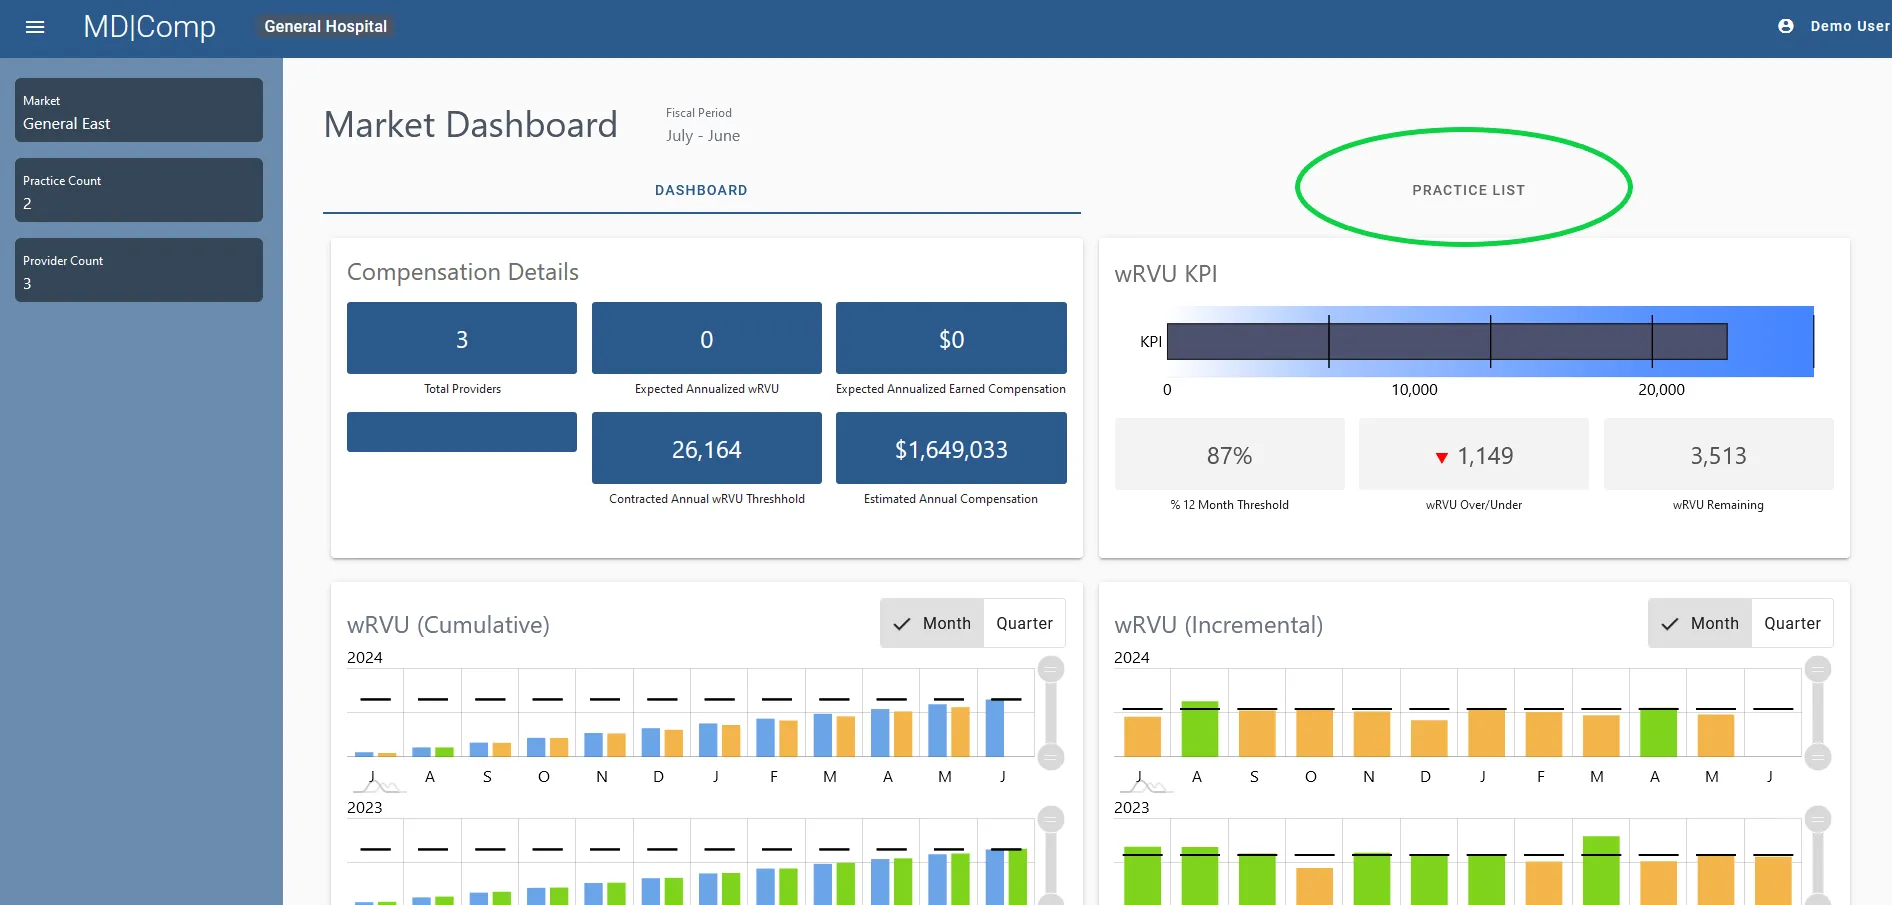
The Practice List
Details for each of the Practices can be accessed from the Practice List tab in the Market Dashboard.
The details for each practice will include:
- Name of practice
- Number of providers
- Annual wRVU Target
- % of Total Threshold
- WRVU Over/Under
- Bar Graph depicting totals against threshold based on the Market Fiscal Period