Practice Dashboards
Practice Selection
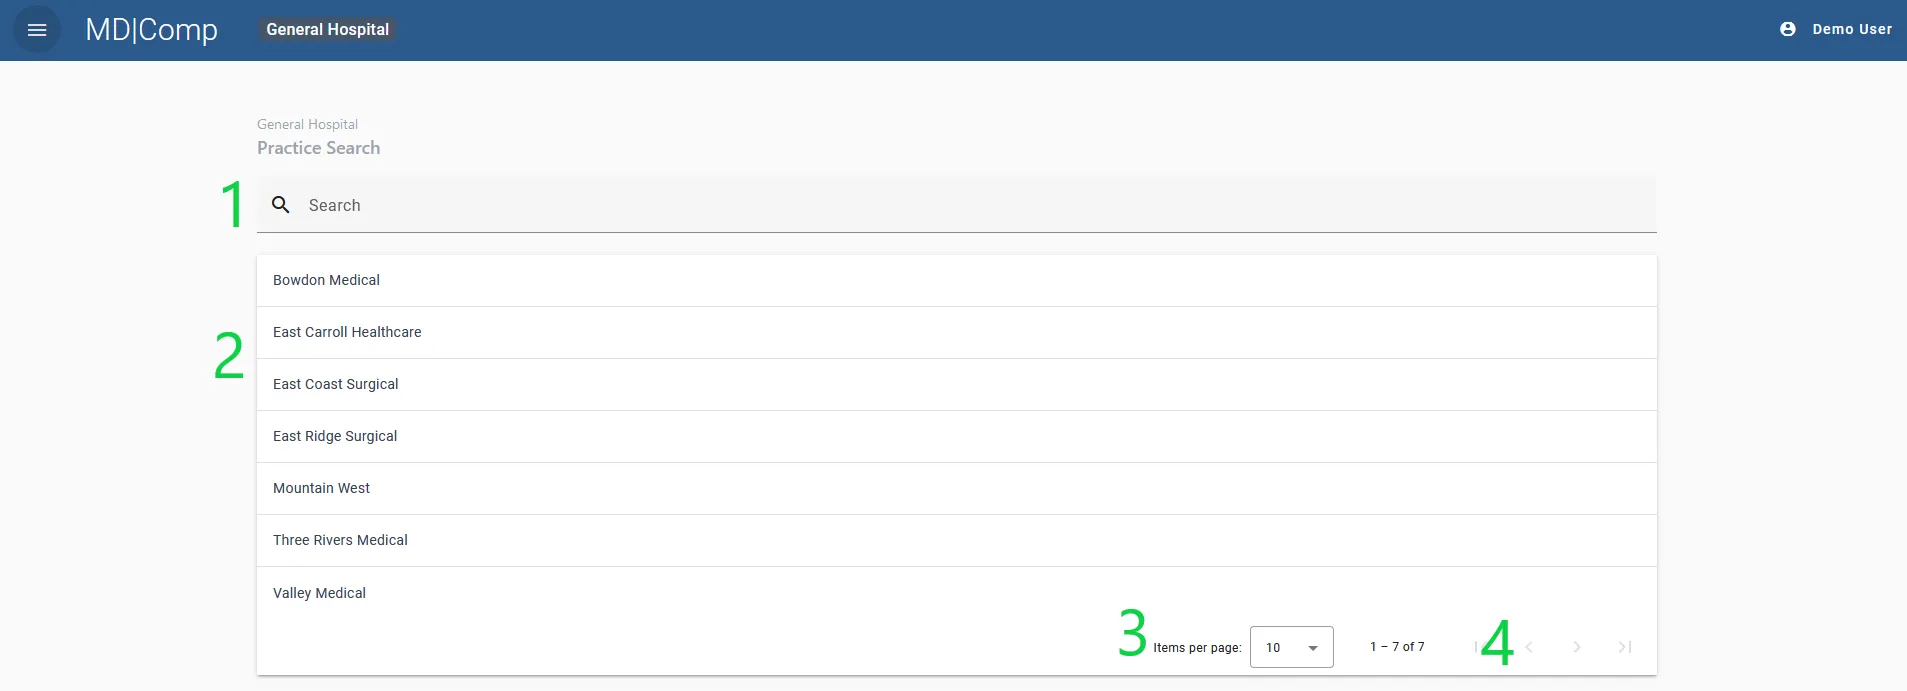
On the Practice selection page, the Practices that are assigned to you are visible in a searchable list. You can scroll by page or search for the Practice’s name. The number of items displayed can also be specified in the paginator.
To navigate to a specific Practice, click on it in the list.
- Practice search bar
- List of Practices
- Number of items per page
- Page navigation
The Practice Dashboard
The Practice Dashboard is intended to give an overview of the performance of the practice as a whole. It may be used to monitor productivity against a department budget.
The Practice Dashboard should NOT be used to calculate compensation for an individual provider as the fiscal years may not match. The Provider Dashboard is intended for this purpose.
All information in the Practice Dashboard is Based on the total for all providers in that Practice. All of the data shown at the practice level is based on the organization’s fiscal year. The fiscal year is noted at the top of the Practice Dashboard.
The Practice Dashboard is made up of 5 main areas of practice information, all based on Enterprise Fiscal Year:
- Practice basic information
- Compensation details
- wRVU KPIs
- wRVU Cumulative KPIs
- wRVU Incremental wRVU KPIs
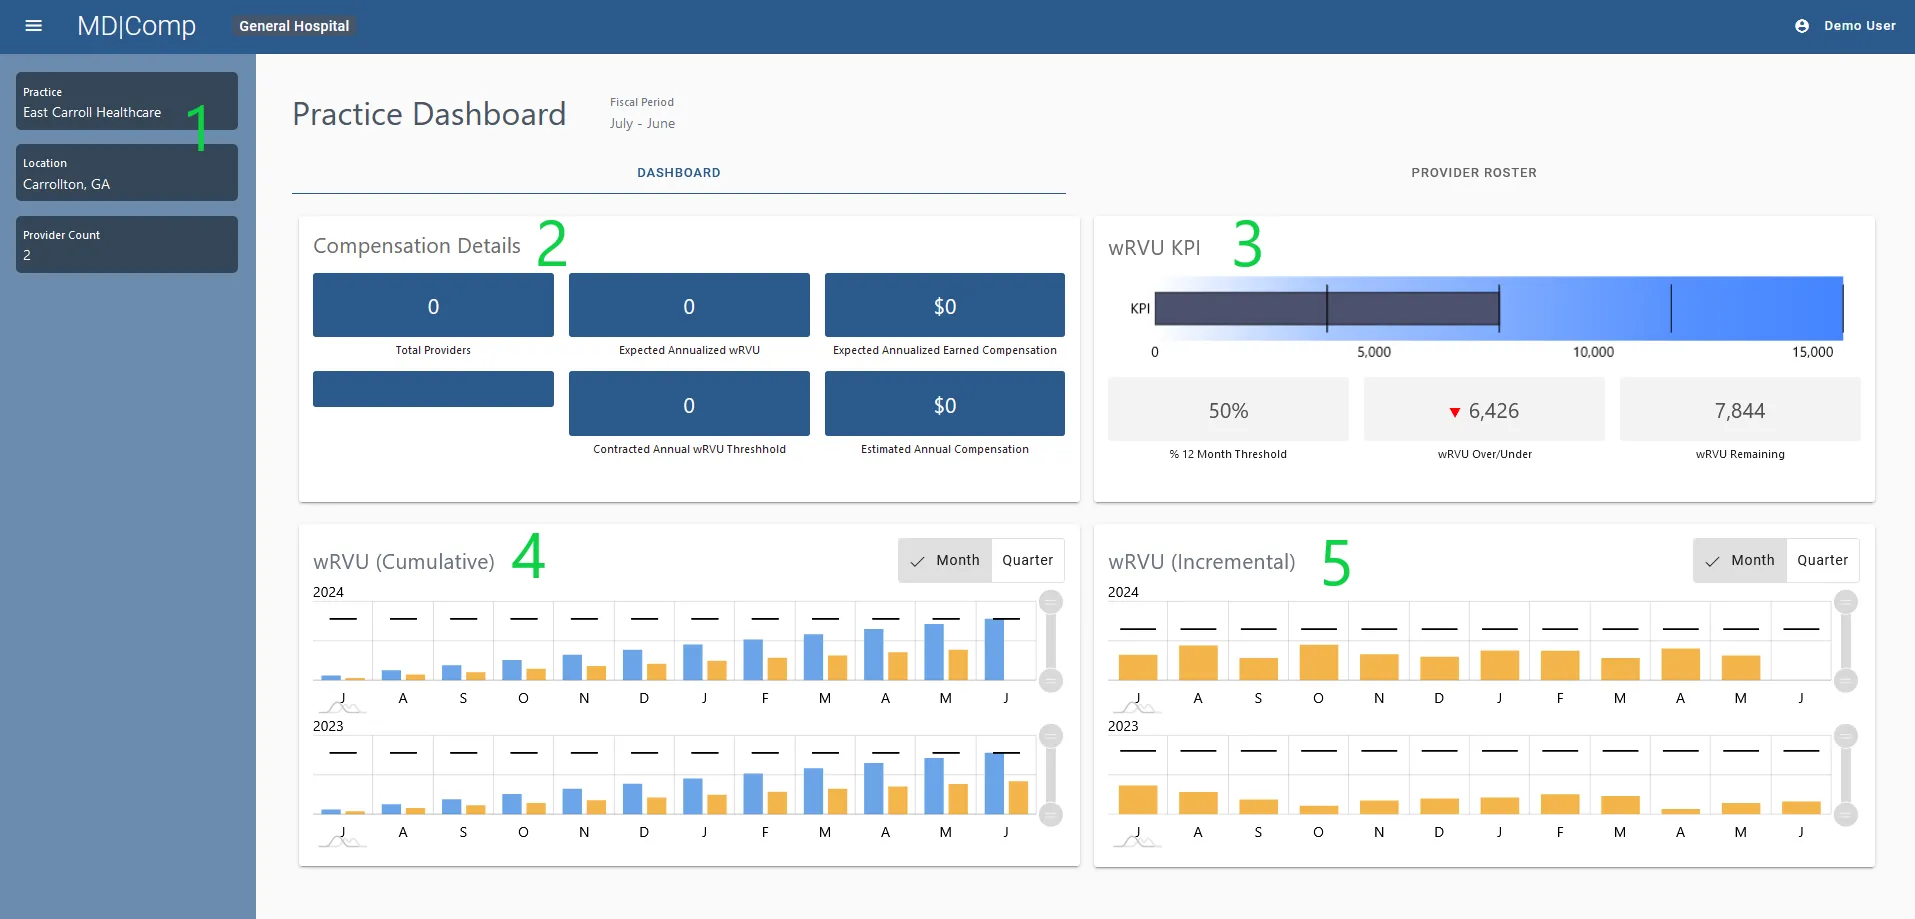
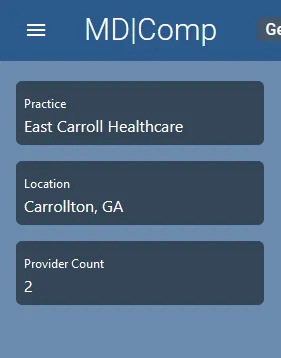
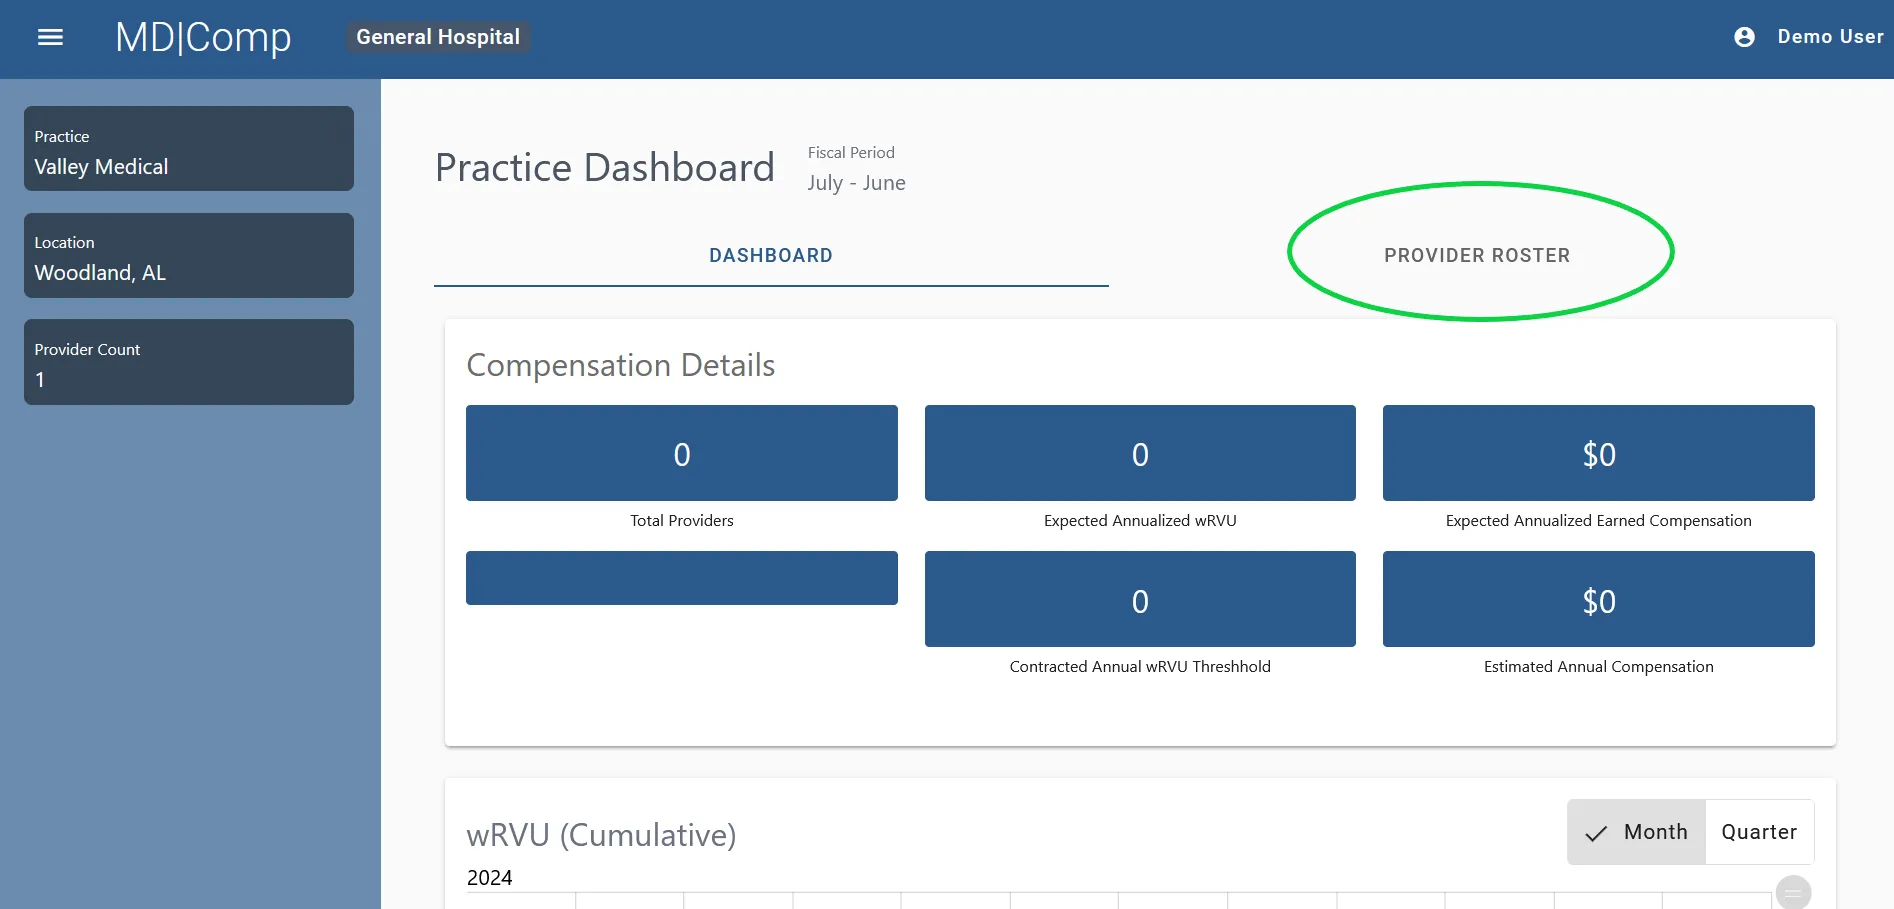
1. Practice basic information
The name of the practice, location and number of providers is visible on the left-hand side of the screen.
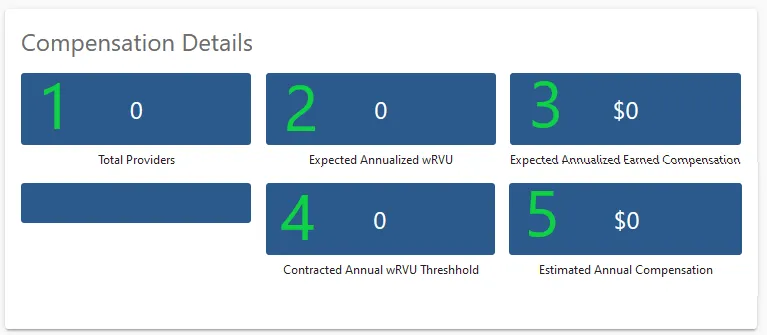
2. Compensation details
The compensation details widget displays:
- Total Providers- Number of providers in the practice
- Expected Annualized wRVU – ( This feature is not active at this time)
- Expected Annualized Earned Compensation
- Contracted Annual wRVU Thresholds- Total of all the Providers’ wRVU thresholds for a 12-month period (Enterprise Fiscal Year)
- Estimated Annual Compensation- Total of all Providers’ Compensation if Thresholds are Met
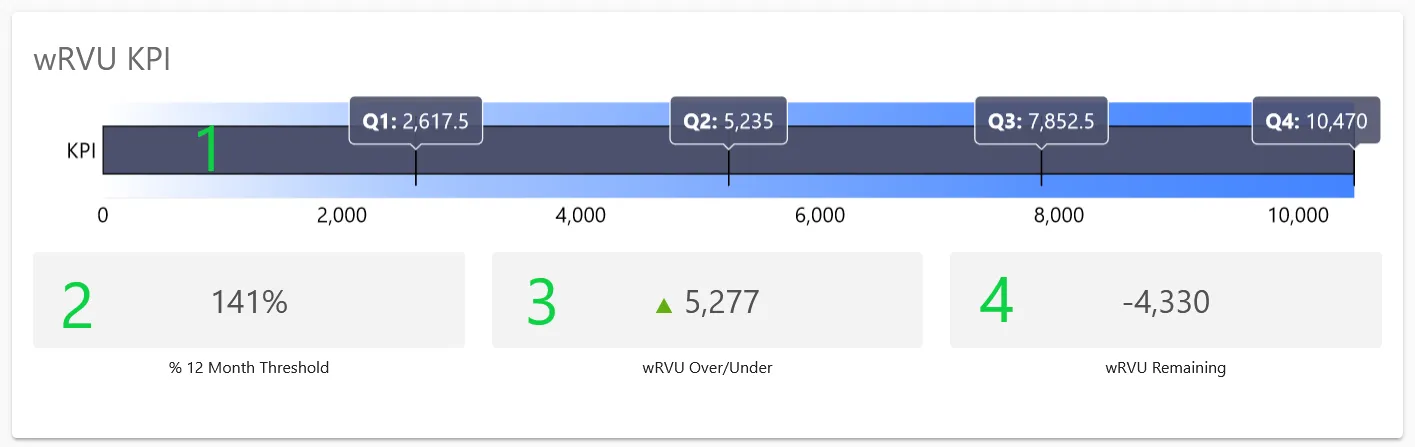
3. wRVU KPIs
The wRVU KPI widget on the Practice dashboard identifies:
- The Fiscal Year to Date total wRVU produced by providers in the practice
- The % of the 12-month Threshold that has been met
- How may wRVUs over or under the practice is based on the current quarter
- How many wRVUs are remaining for that year
4. wRVU Cumulative/ wRVU Incremental wRVU KPIs
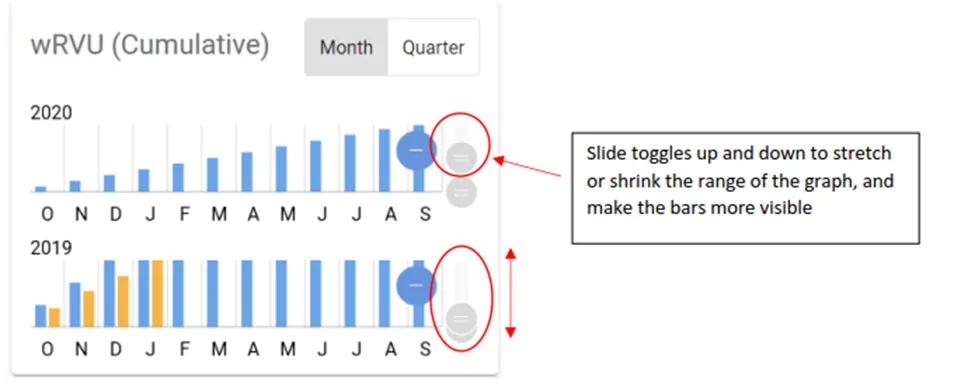
- Cumulative and Incremental wRVUs are shown by month or quarter, based on the Enterprise Fiscal Year.
- The month/quarter toggle buttons are seen at the top right of each window
- Toggles are shown next to each data set and can be used to enhance the data view.
- The Cumulative Graph depicts the actual wRVUs through the year by month or quarter as compared to the threshold expectation
- The Incremental Graph depicts the actual wRVUs by individual period as compared to the threshold expectation
- At the practice level, wRVU totals represent wRVUs for all providers in that practice
- In both graphs, a comparison to the previous year is also provided.
Key for interpreting the chart:
- Blue Bars= Expected Threshold for the period selected.
- Orange/Green Bars= Actual wRVUs (Bars turn green if the threshold is met).
- Black Line = Goal for the period selected.
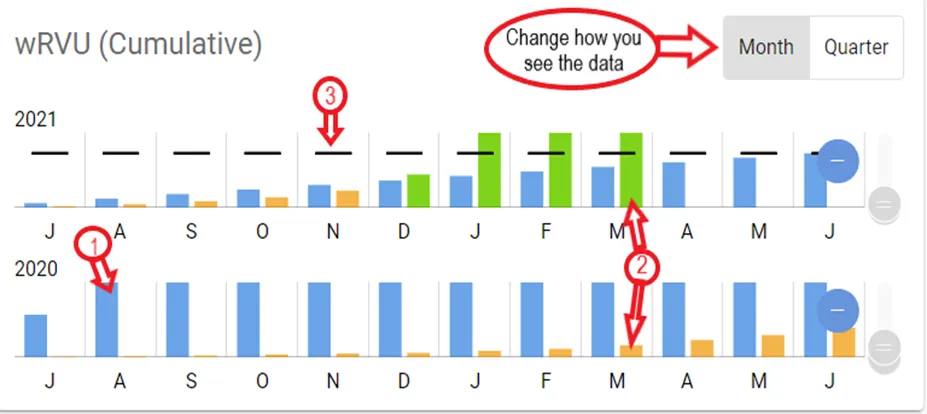
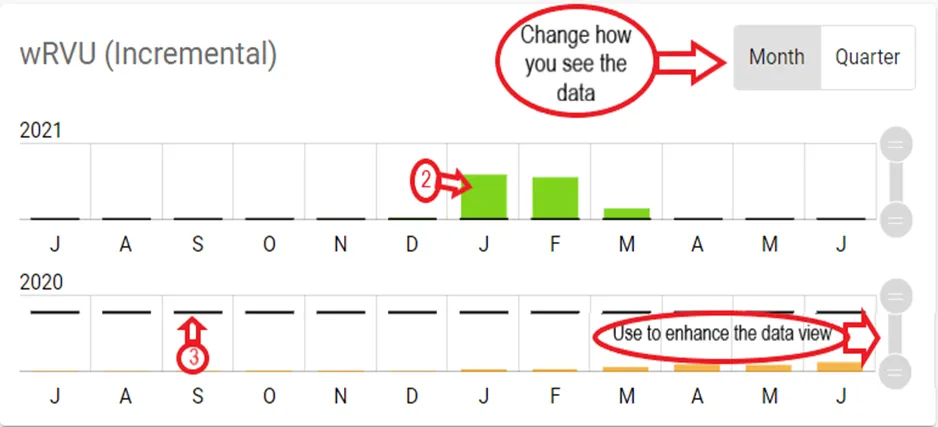
The values of each bar can be viewed by hovering over the bar.
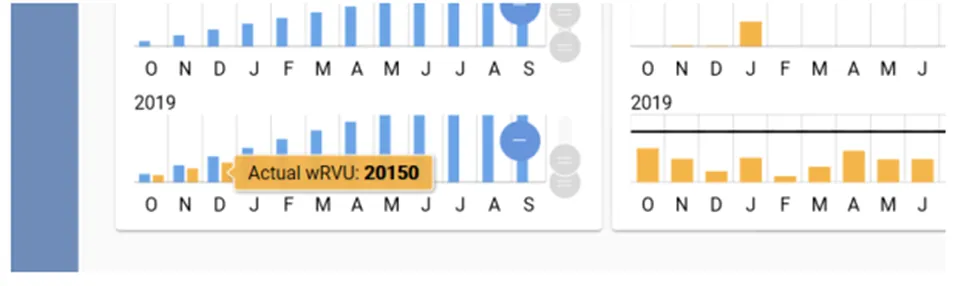
In cases where the value is too small for the bar to be visible, you can use the “stretch” controls to expand the range of the graph to allow the bar to be seen.
Provider Roster
Details of each of the Providers can be accessed from the Provider Roster Tab in the Practice Dashboard. The Provider count and Provider roster should match.
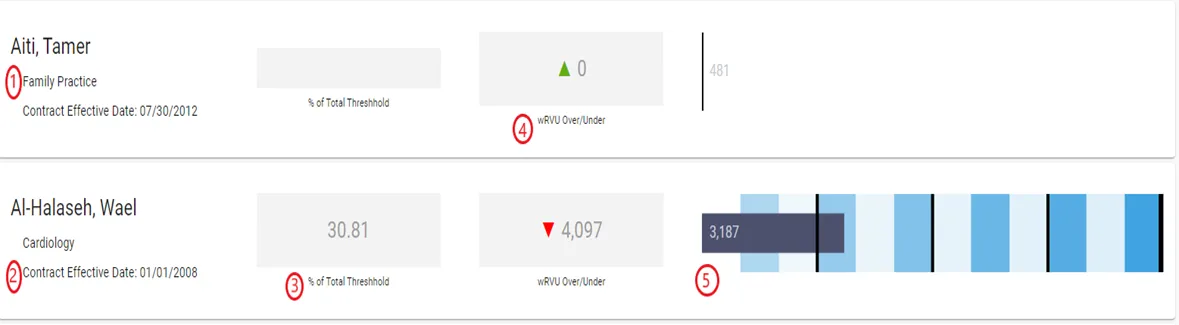
Click on the Provider Roster tab to get more detail on each of the providers in the practice. The Provider Roster in the Practice Dashboard will have many of the same elements seen in the main Practice Dashboard. The details for each provider will include:
- Specialty
- Contract Effective Date (or date from which INDIVIDUAL wRVU compensation calculation begins)
- % of Total Threshold for 12-month period
- wRVUs over or under for 12-month period
- Bar Graph depicting totals against threshold based on the Practice Fiscal Period
- Note that the bar graphs here have the some of the same quarter markers as the Practice Dashboard