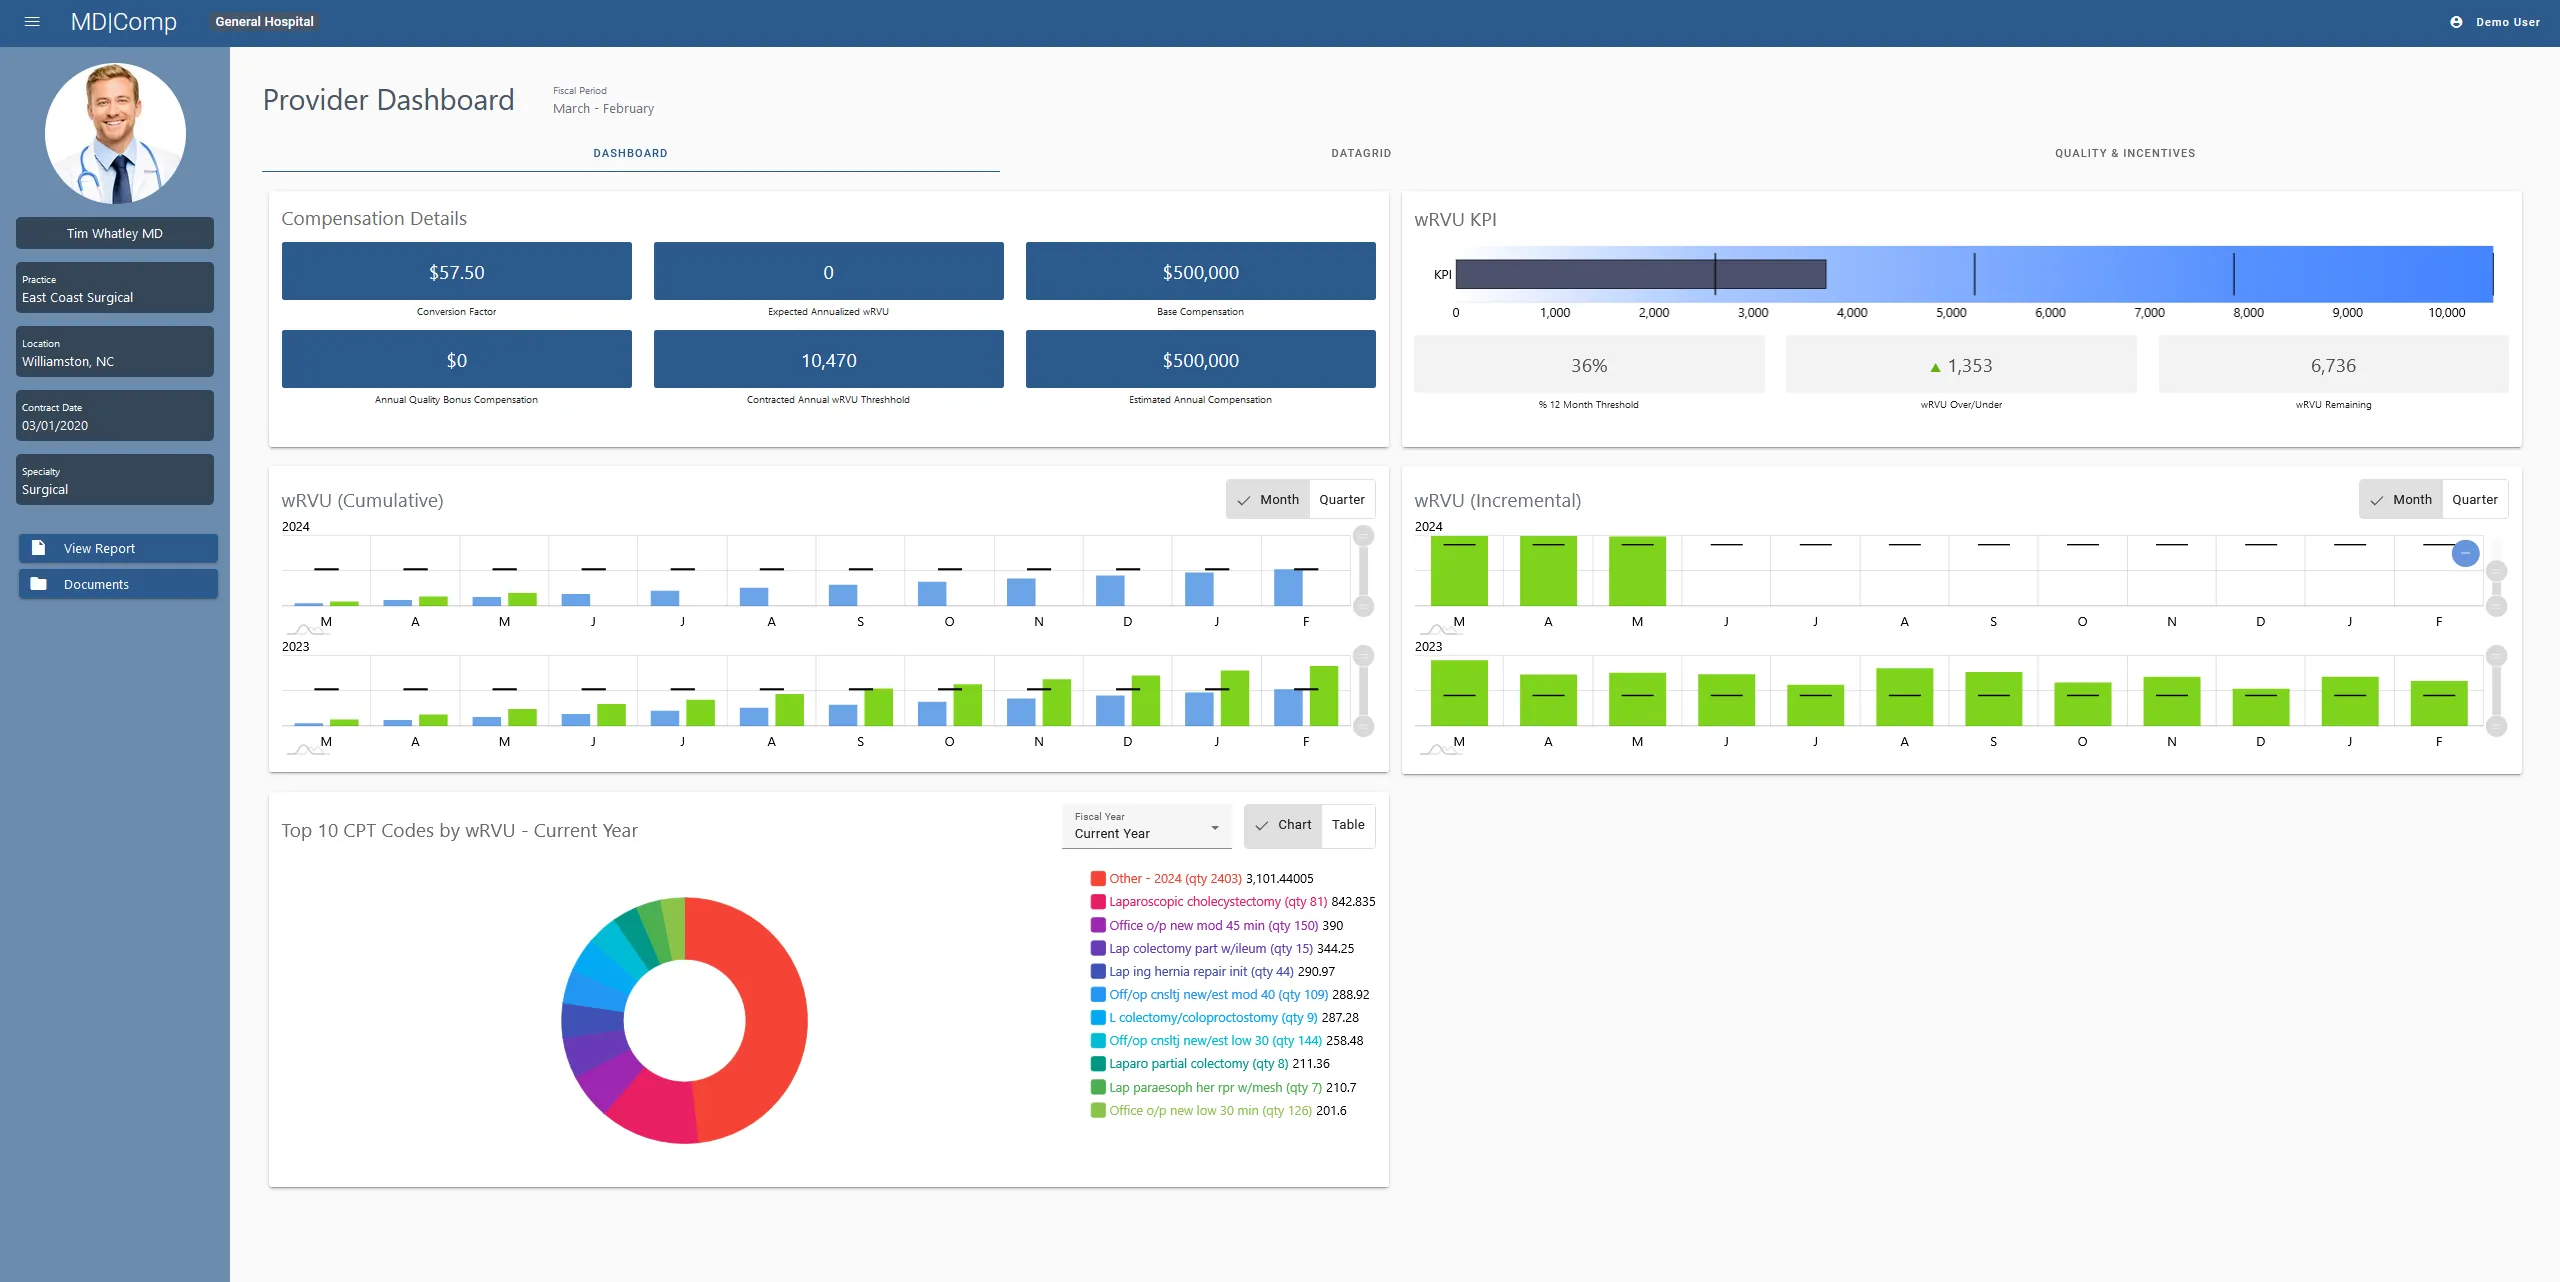
Provider Dashboard
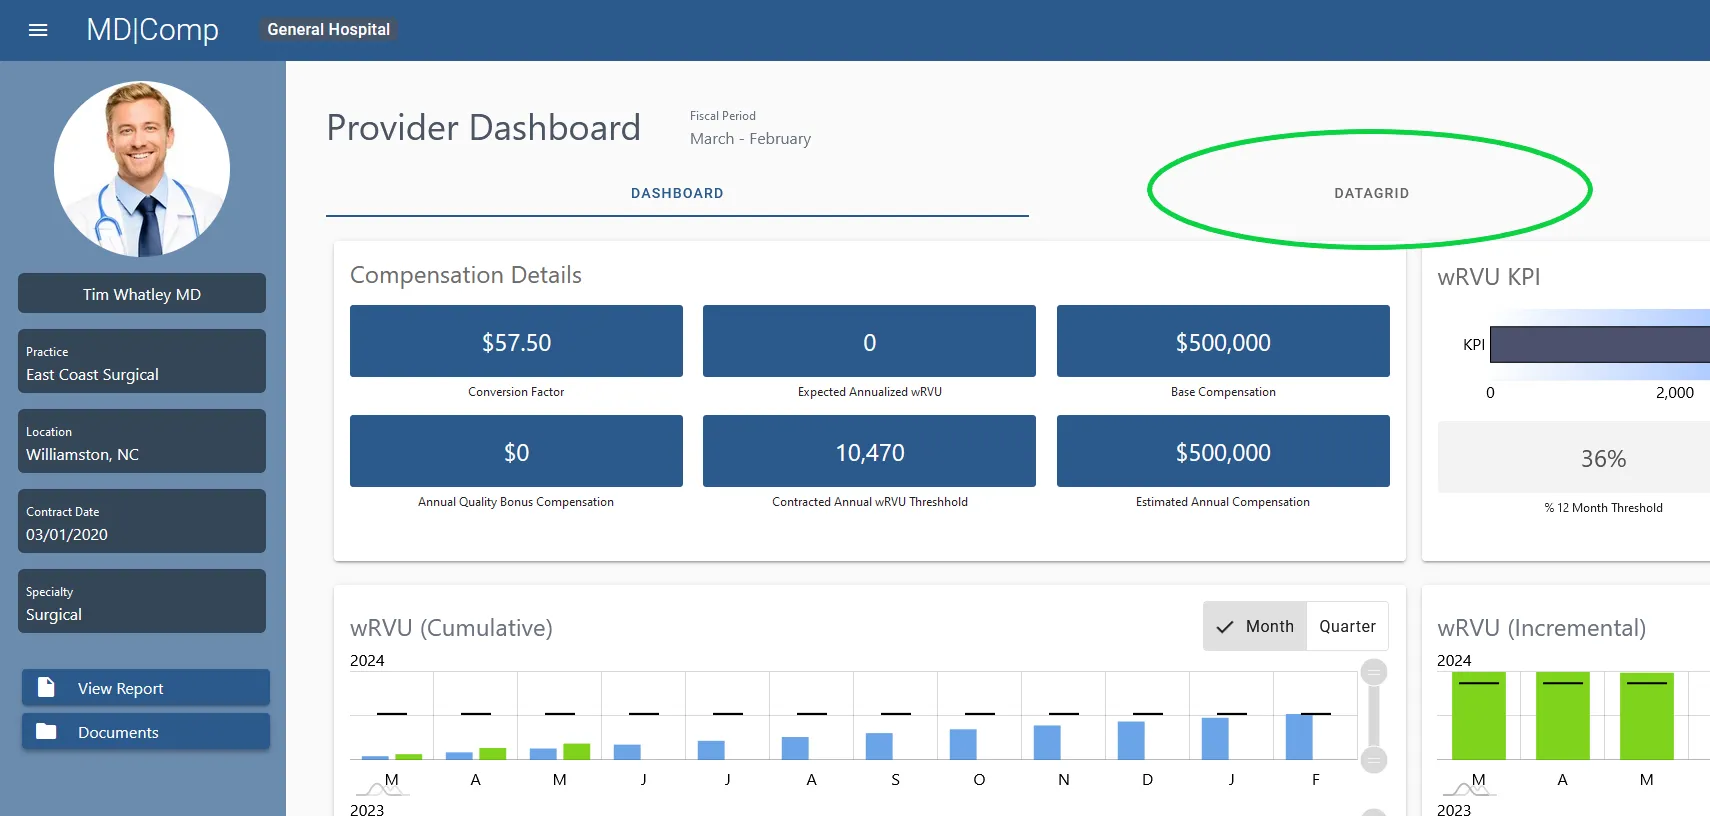
The Provider Dashboard is made up of four main areas of provider information, which are based on the fiscal period specified by the contract for each individual provider:
- Provider basic information
- Compensation details
- wRVU KPIs
- wRVU Cumulative/ wRVU Incremental wRVU KPIs
- Top 10 CPT Codes by wRVU (Previous calendar year and YTD)
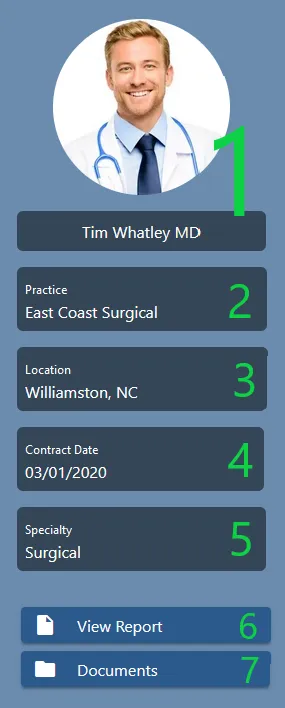
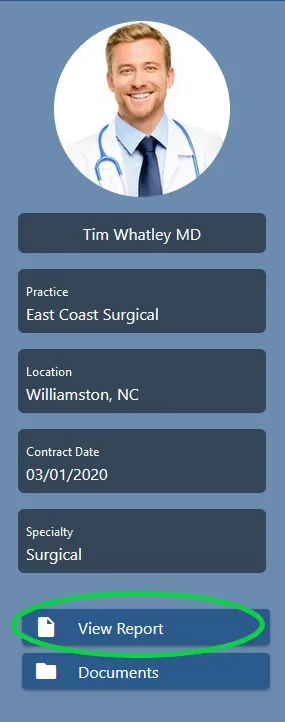
Basic Provider Information
- Provider Name and Photo (if available)
- Provider Practice
- Provider Location
- Provider Contract Effective Date (Date from which their Fiscal Year starts)
- Specialty
- Link to View a Printable Report of the Provider Dashboard
- Link to Pull Provider Documents (Copies of Contracts and Other Agreements)
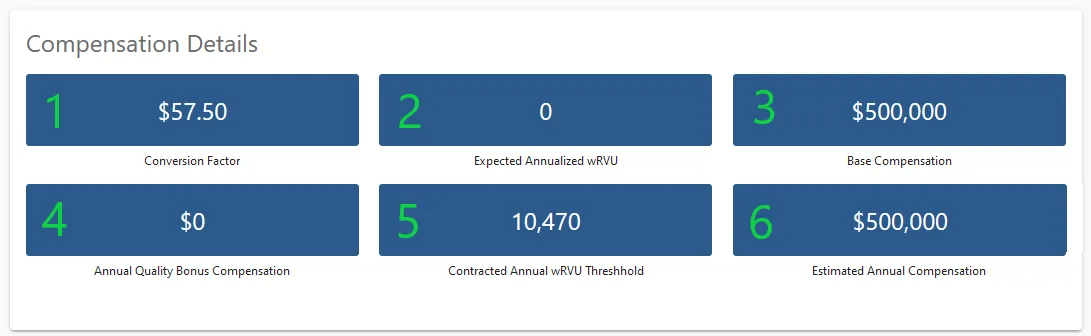
Compensation Details
- Conversion Factor as Identified by the Contract**.
- Expected Annualized wRVU (if your organization has not enabled this feature, it will always show 0).
- Base Compensation.
- Annual Quality Bonus Compensation (if your organization has not enabled this feature, it will always show 0).
- Contracted Annual wRVU Threshold.
- Estimated Annual compensation (Based on Threshold).
**NOTE: If the contract specifies a tiered conversion factor, then the amount shown will represent the conversion factor base on the current wRVU productivity. The amount will change in accordance with the tiered model.
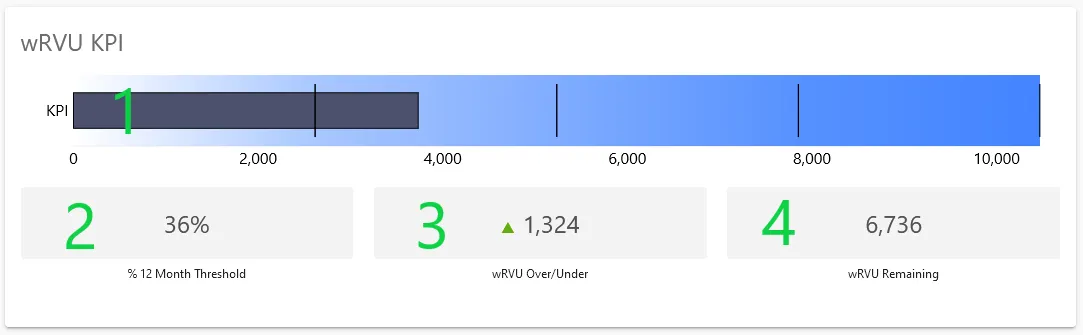
wRVU KPI
- Bar graph showing progress towards the annual wRVU threshold. This bar can be hovered (or tapped, on touch devices) to show numeric values.
- Percentage of the 12-month threshold produced.
- wRVUs over/under the threshold for the current quarter.
- wRVUs remaining to hit the Annual Threshold.
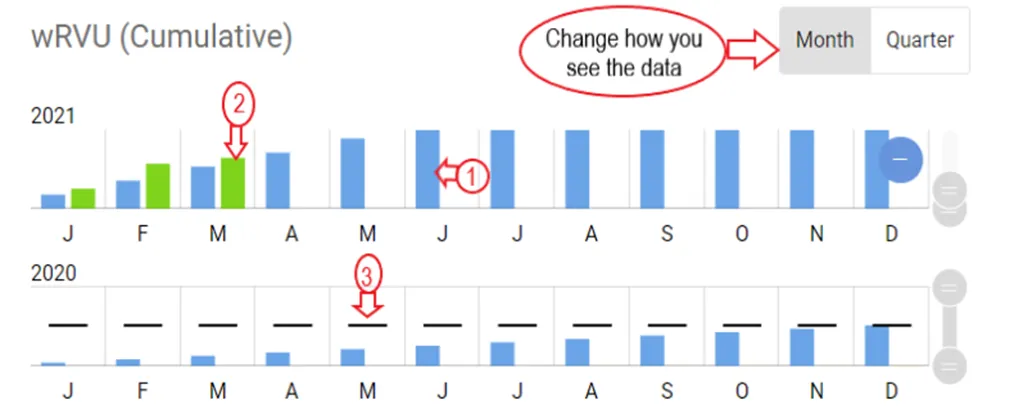
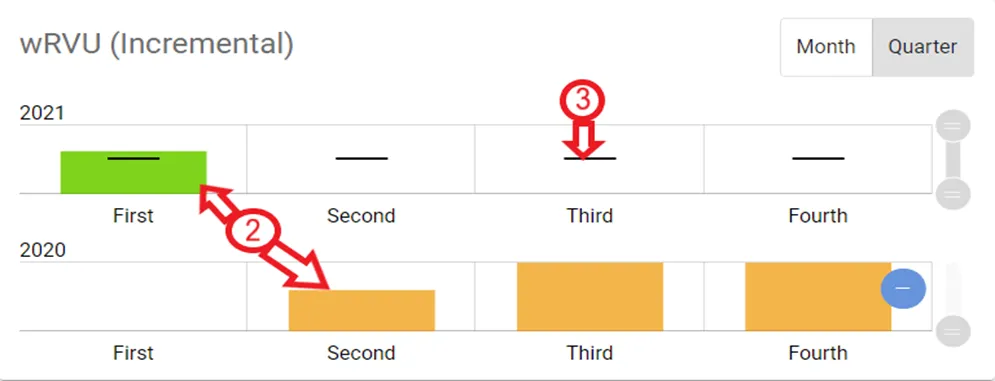
wRVU Cumulative/ wRVU Incremental KPIs
- Cumulative and Incremental wRVUs are shown by month or quarter, based on the Enterprise Fiscal Year.
- The month/quarter toggle buttons are seen at the top right of each window -Toggles are shown next to each data set and can be used to enhance the data view.
- The Cumulative Graph depicts the actual wRVUs through the year by month or quarter as compared to the threshold expectation
- The Incremental Graph depicts the actual wRVUs by individual period as compared to the threshold expectation
- In both graphs, a comparison to the previous year is also provided.
Key for interpreting the chart:
- Blue Bars= Expected Threshold for the period selected.
- Orange/Green Bars= Actual wRVUs (Bars turn green is threshold is met).
- Black Lines= Goal for the period selected.
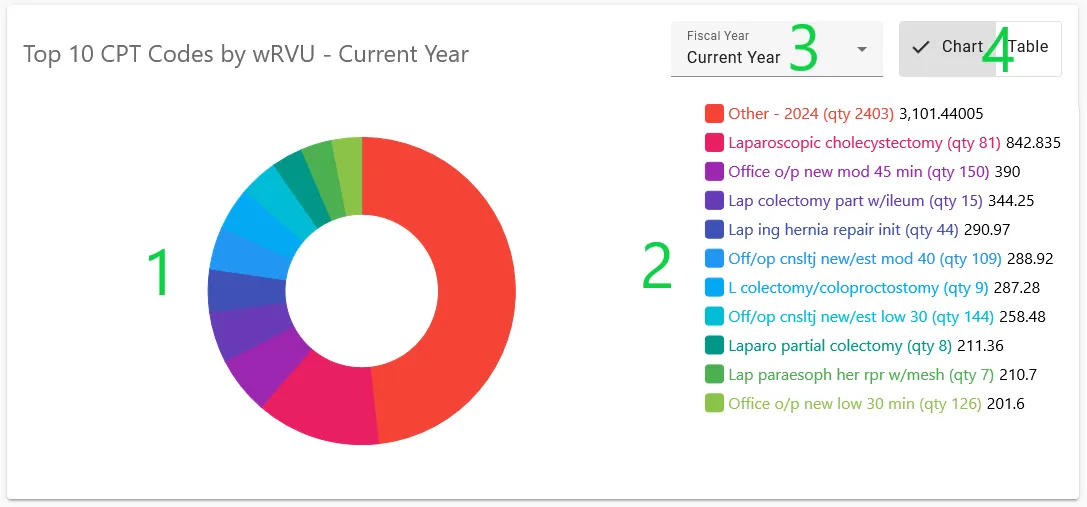
Top 10 CPT Codes by wRVU
This component of the dashboard can be toggled from pie-chart to table format. You are also able to switch the data between current year and previous year.
Pie Chart
- Pie chart detailing the top wRVUs
- Each slice in the pie chart can be clicked (or tapped) to “pop out” the slice.
- Legend for pie chart
- Each entry in the legend can be hovered to show the corresponding slice in the pie chart.
- Year toggle - switch between current and previous fiscal year
- Chart/Table toggle - switch between pie chart format and table format
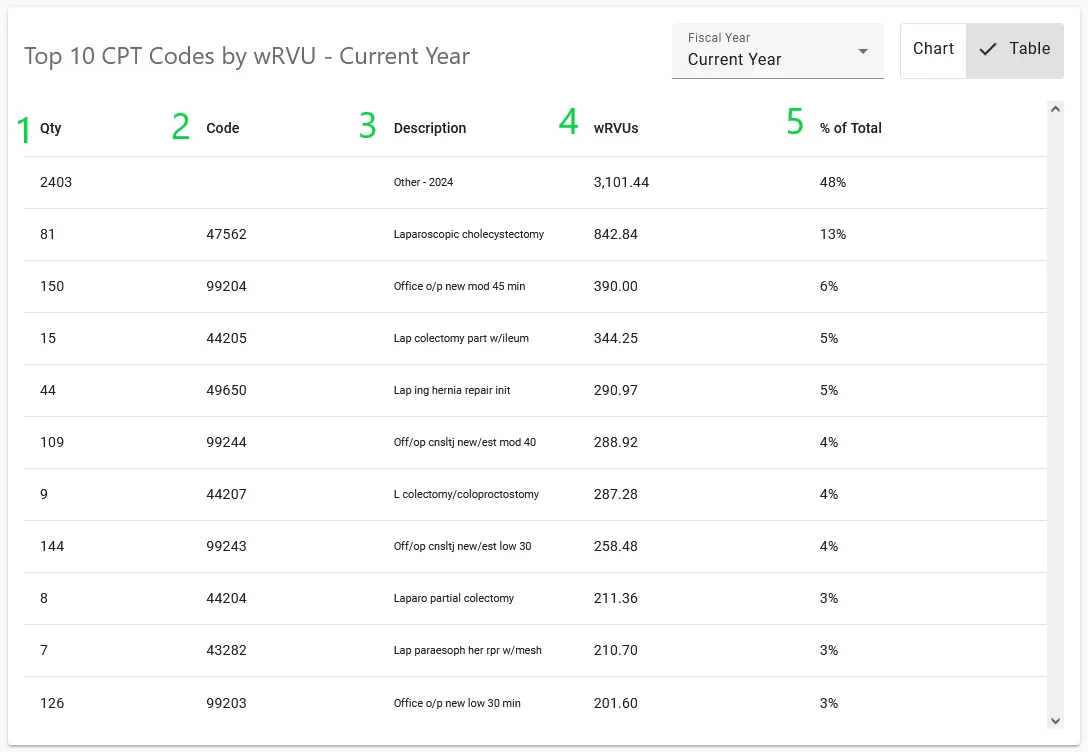
Table
- Quantity of Each Code
- CPT Code
- Description of CPT code
- Total wRVUs for each Code
- Percentage of Total wRVUs produced towards the selected year
View Report
The View Report button, located at the bottom of the provider information sidebar, brings up a printer-friendly view of the dashboard data.
Click on the Print button at the top right of the screen to bring up your system’s print dialogue.
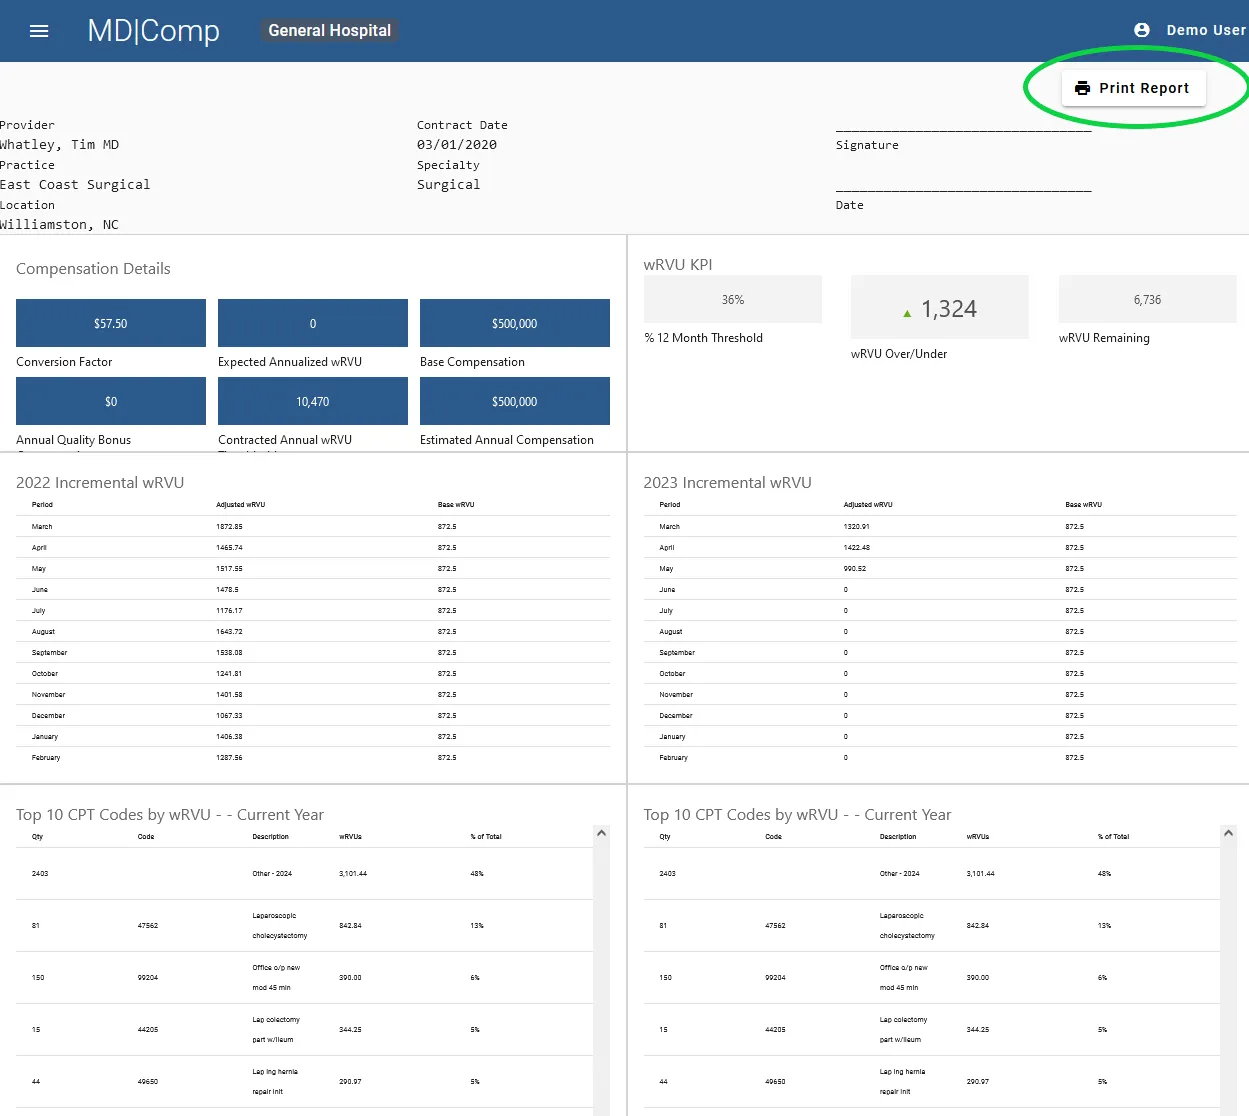
A signature and date line is added to the printer-friendly version for convenience.
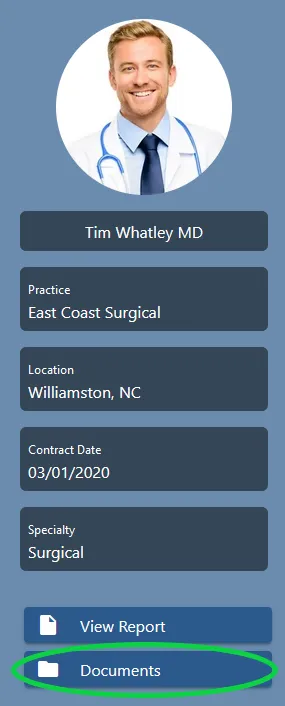
Documents
Documents such as contracts and amendments can also be stored within MDComp. At the bottom of the provider information sidebar, there is a “Documents” button on the physician’s profile.
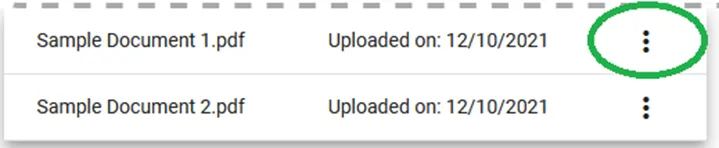
After clicking on the Documents button, a list of documents that were uploaded will appear. You will have the option to view a selected document, upload documents, or close the screen.
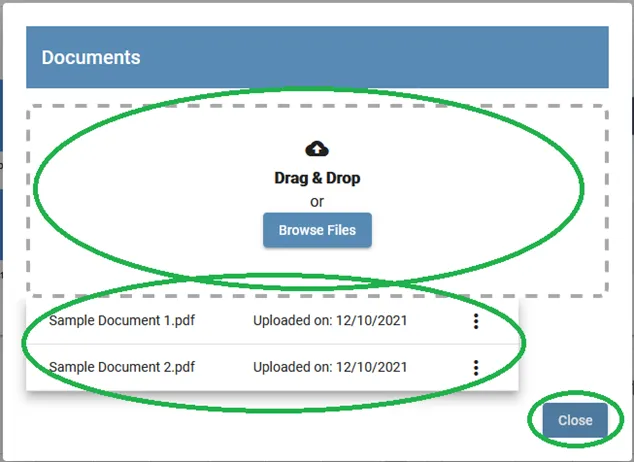
To retrieve uploaded documents, click the triple dots to the right of the document you would like to open. From here you can select, view, rename or delete (Note: deleting a document is an operation that cannot be undone).
DataGrid
The DataGrid tab provides details on the transactions that make up the wRVU totals. To navigate to the DataGrid, click on the DataGrid tab.
The DataGrid is visible within the specific Fiscal Period. The DataGrid presents the following:
- wRVU Date
- Service Date (This column must be enabled by your organization)
- Rendering Provider
- Supervising Provider (if applicable)
- Claim ID
- CPT Code
- Charge Units
- CMS Assigned wRVUs
- Adjusted wRVUs
- Modifiers
- Filter Column - choices to filter by are: Claim ID, CPT Code, Modifier, Service Date, WRVU Date
- Filter Input
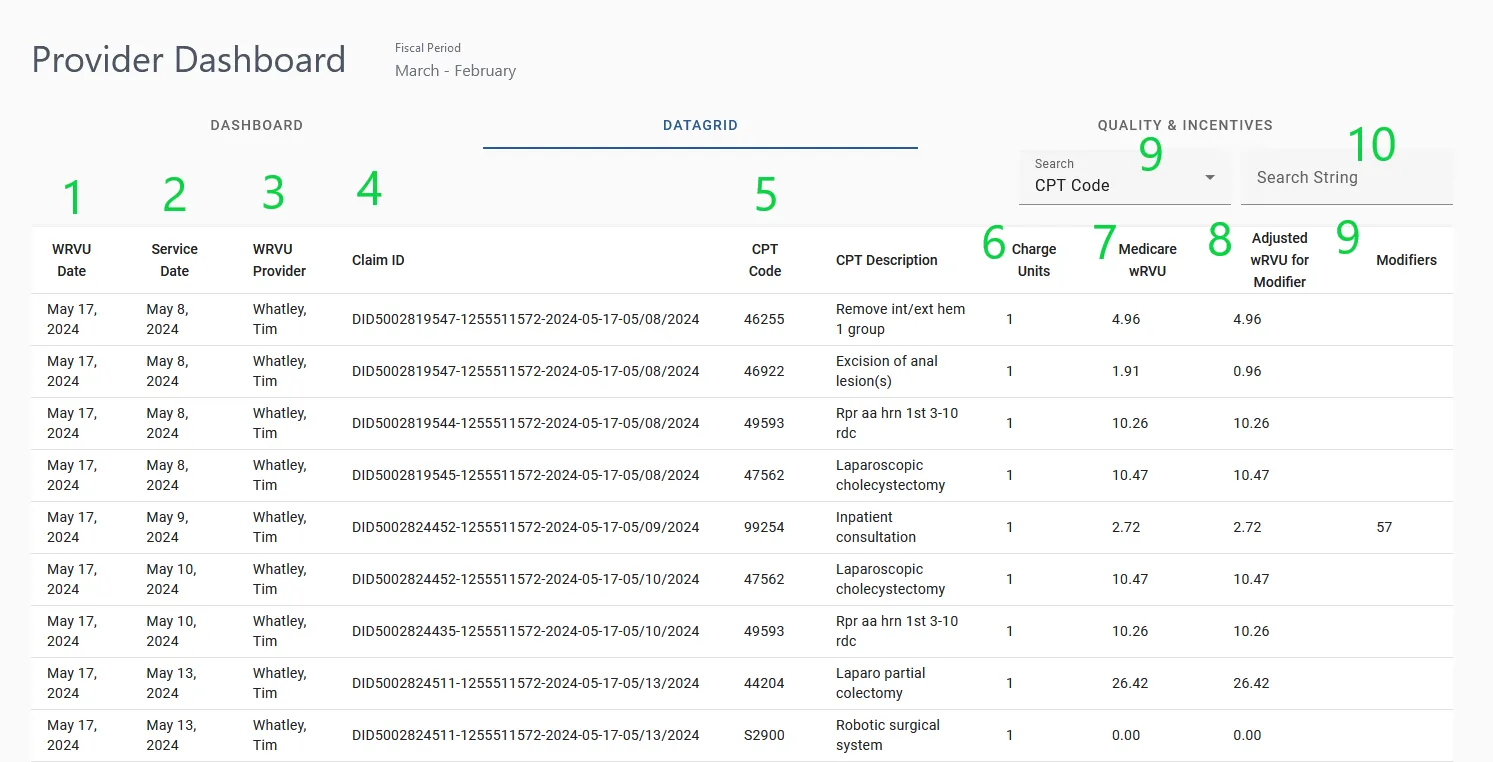
Using the input (11 and 12), you can filter rows based on a search input. To do so, choose a column (11) to filter by and type your search string. The rows in the datagrid will filter based on your criteria.